The map $x_{n+1} = r\,x_n(1-x_n)$ on $[0,1]$. This page exists to show what a record looks like: a figure carries the code that drew it and the numbers behind it, so the catalogue is readable by a person and by a program.
Sec. 1. Orbits (1)
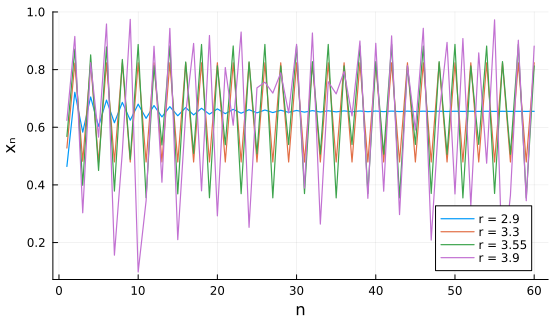
Four orbits from $x_0 = 0.2$, through the period doubling into chaos.
 ⤓ download
Sec. 2. Bifurcation (1)
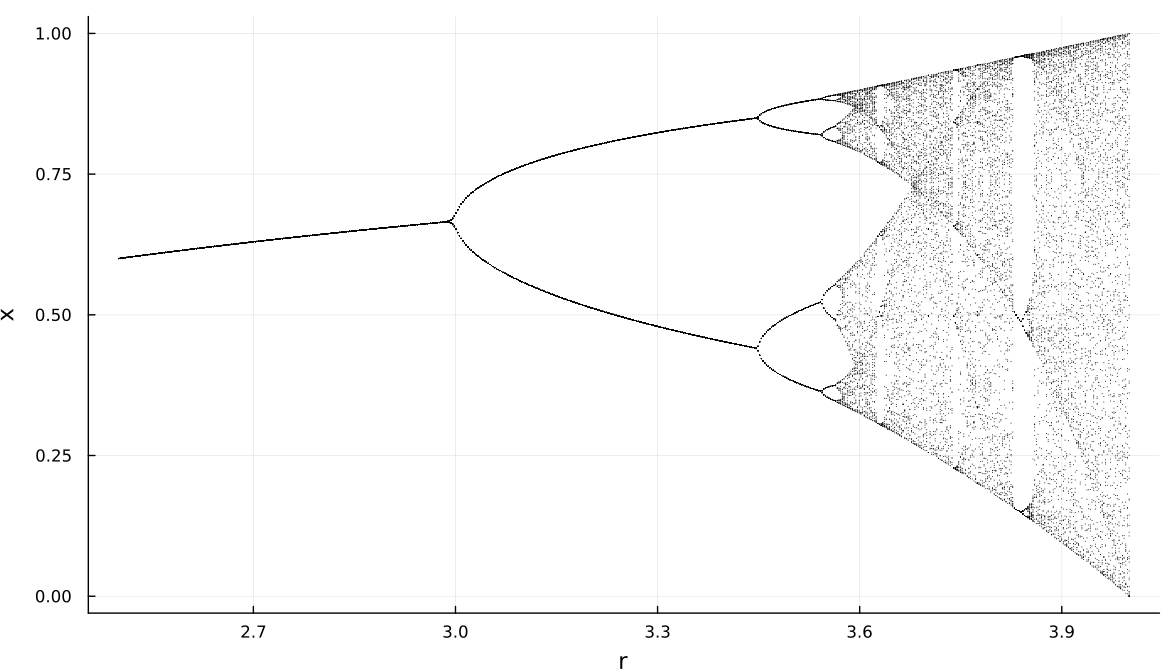
The attractor as $r$ sweeps $[2.5, 4]$; the accumulation point is near $r \approx 3.5699$.
 ⤓ download
| r | behaviour |
|---|---|
| 2.9 | fixed point |
| 3.3 | 2-cycle |
| 3.55 | 4-cycle |
| 3.9 | chaotic |